Soundbites: Mapping Data To Outcomes
Hi, this is Deirdre Hess with Heron Soundbites and I’m here today with Maggie McCullough of PolicyMap, which is a Heron Grantee and we are here to talk about your impact and hear a little bit more about the stories of what’s been going on. Can you first just tell us what PolicyMap is and does?
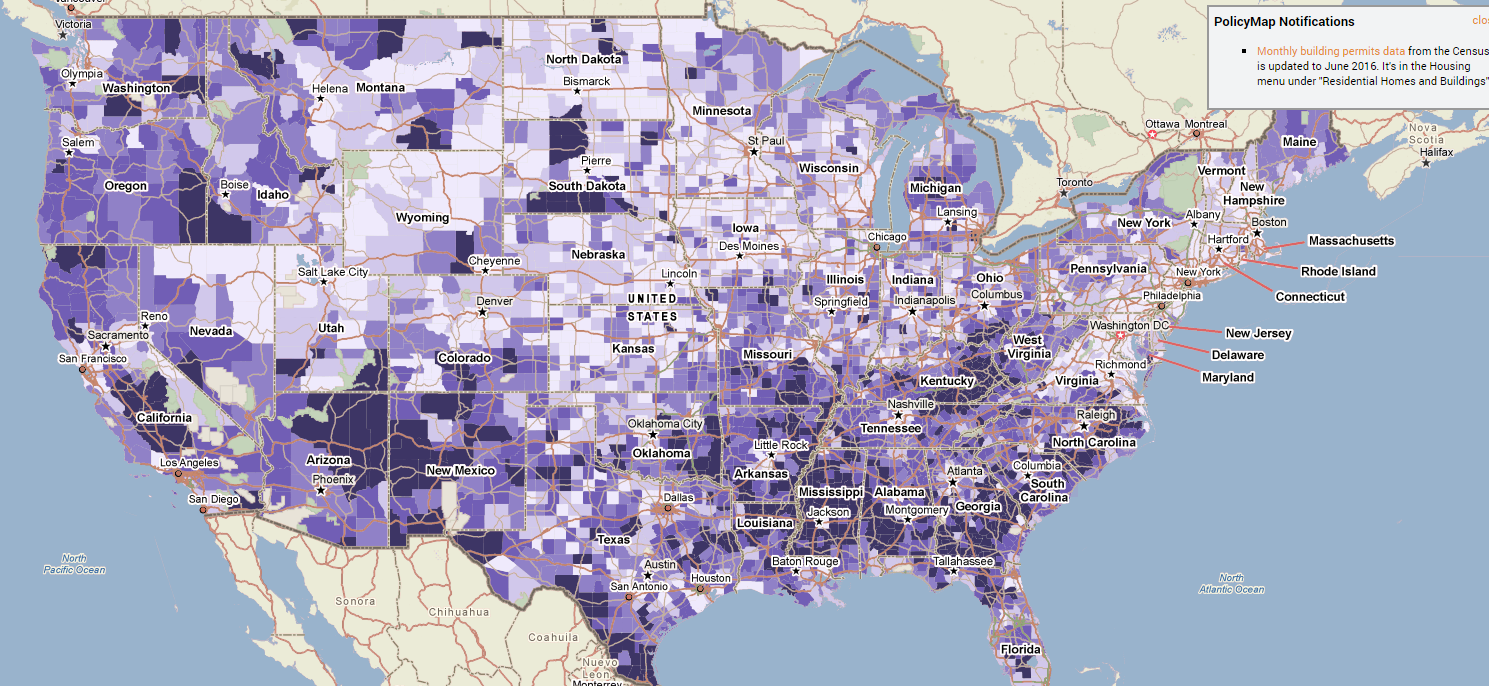
PolicyMap is an online data and mapping application that we created in 2008. We collect data from all over the place. From public sources, from proprietary sources, and when I say data, I mean geographic data; so we collect this data, we make it available in maps, tables and reports for people to be able to access information about the communities in which they work.
We launched it with the belief that data has the power to change communities and markets, but that not enough people, organizations are actually able to use data to understand what they’re doing in a community, understand its impact, think about where they want to invest next because the data is a) hard to find and hard to understand and b) you need a level of technology, a set of technology skills to be able to map and analyze data. That barrier was something we wanted to overcome by creating a very simple tool, with a simple interface, loaded with data. People have called it ‘Google Maps on steroids’, and that is what we are at our core. It’s about getting data and information into the hands of the people that need it in a really simple way.
What’s the “why” there? What’s the vision of what you see what people might be able to do with that data?
The “why” is we were birthed out of a community development financial institution which has been around for 30 years, the Reinvestment Fund, and they’ve been making loans for affordable housing, charter schools, grocery stores, healthcare centers, and so at the end of the day, they’re a nonprofit bank. They’re a lender and they need to understand the places in which they’re making investments. That applies to the USDA, for example. The US Department of Agriculture is a new customer of ours and for the first time, they’re able to see where all of their apartment buildings are across the country, where all of their home loans have gone, and they’re able to see them in combination with where HUD’s multi-family apartment buildings are, where their singly family deals are.
They can look at a rural community, an under-served rural community that they’re trying to get capital into, and they can say, “Wow, this is what we’ve done to date. What else should we be doing here?” Or “Here’s an under-served community that only have we not touched, HUD hasn’t touched it, and the other federal agencies we track, (all federal agency data in PolicyMap) no one has touched it. Why, and what can we do to get capital into that place?”
I think it’s not just the ability to see one layer of data at a time, it’s the power of all the data together in one single resource that makes it unique and quite valuable for government entities, at the local, state, and federal levels, banks, commercial entities, and actually one of our biggest growing group of customers are actually universities. Universities are able to get access to PolicyMap and students that would never have a mapping course in their entire four years of undergraduate now get to use an online mapping tool. They can be in public health, and they could learn about the communities around a hospital that they might be thinking about working in. They could be in communications and now they can understand and communicate about geographic data in a place. They can be in sociology and understand the patterns and trends of diseases or population migration, any of that.
All of that’s available in a tool they never would have been able to do that before because there isn’t a simple online resource that they could use.
That sounds amazing. Have you heard of any stories of what people have actually done or have been able to do with this?
The city of Philadelphia has an enterprise license to PolicyMap and they have six agencies that are now loading data into PolicyMap, and it’s a single resource for their geographic information. They have used it to successfully apply for their choice neighborhoods grant for HUD. They are now using it to track their work in that choice neighborhood. They are currently writing their affirmatively furthering fair housing plan for HUD and they’re using PolicyMap to make better plans that they think more accurately solve problems, more strategically solve problems in their community. They are relying entirely on the data that’s in PolicyMap and other data, local data that they have that they’re loading into it.
That’s incredible. If I recall correctly, I think I read about a year ago that Philadelphia was a large city with the highest poverty rates in the country. May or may not be remembering that correctly.
I think it might be Camden that has the highest poverty rates, which is a sister city, but yes. Philadelphia has pockets, for sure, of extremely high poverty rate areas and that’s what they’re trying to think about, what kind of resources do they bring to those areas, in ways that will actually change the future for those places.
Being able to think about that with all those agencies at the table, all the data that those agencies have, they can zoom into a particular neighborhood, see what’s the poverty rate here? What are we all collectively doing here, and what else should we be doing? What are the other things that we should be thinking about in terms of understanding this neighborhood that can help us create a strategy that will improve things?
That’s great. Let’s switch gears a little bit to talk about the Enterprise Capital Grant that PolicyMap received from Heron. What was that money for? Why was it needed and how did you use it? What’s the outcome of that?
When we launched PolicyMap in 2009, we had seed money to build it from Reinvestment Fund, so we were a division of Reinvestment Fund, they had the seed money to build PolicyMap, we built it. We had a business plan which assumed we would be able to sell subscriptions to our service and that that would allow us to become self-supporting. We had three people and nobody was swiping their credit cards. Nobody was buying subscriptions which, in retrospect, of course, because we weren’t doing any marketing. Nobody knew who we were. Nobody knew that we existed.
We survived, financially, by piecing together one-time monies and I think that’s fairly common in the nonprofit space. We got some support from the MacArthur Foundation, we got some one-time money from the state of Pennsylvania. Bank of America gave us a little support. All operating support to just sort of keep us going, but we needed to both create a business plan, a model, that would allow us to be self-sustaining going forward, and we needed an investment, much like a for profit company might get an investment, to help us build that out so we were able to put a plan together and with the investment money from Heron, and then those that came along afterwards and matched it, we hired a sales division which we had never had before. We hired more data people to be able to increase the amount of content that we were putting in PolicyMap.
Impact Notes:
-Worked with the Office of the Secretary of Agriculture and partners to develop an interactive web mapping tool tailored to the growing opioid epidemic in rural America.
-Provided an index of segregation that allows users to click on the map and instantly understand the level of segregation and the racial makeup of neighborhoods.
-Helped create Childcare Map, a tool for researching and exploring childcare resources in Philadelphia as well as Newark Child Care Map, for Newark, New Jersey.
We made a one-time investment into some improvements into our technology, and that allowed us to get off of these one time monies that are really not reliable revenue sources and strategically sell products, much the way a for profit business might, subscriptions, enterprise licenses, and develop, because these are annual licenses, a recurring revenue stream that’s allowing us to become self-sustaining. At some point, we’ll have enough money to be able to continually invest at the end into our own platform.
It really was the ability to create a self-sustaining business model that will now position us for growth, while at the same time, still focusing on our mission. So at the end of the day we’re selling subscriptions and enterprise licenses in order to be self-sustaining and grow, but we offer a really robust free version of PolicyMap, which is used by community groups, by consultants working for community groups. It’s used by health agencies. There’s a lot that you can do with the free side.
Tell me about some impact metrics. Some things that actually speak to you about the impact that you’re having.
We have 40,000 users, and over 70 percent of them are free users. We’re thrilled with that because that is a mission hit for us. We have 94 universities that are now customers of PolicyMap, that means almost 1.5 million students have access to this kind of tool. That’s a huge success for us, and every year we have growing numbers of people making maps on PolicyMap, so we know that each year, we are penetrating a little bit more, as more and more people start to use the tool.
That’s fantastic. Is there anything else you have on your mind that you want to share with our audience?
Only that I think that were it not for the Heron investment that started the entire process of then getting additional dollars to complete our raise, we would never have been able to do this, because it was very flexible. It allowed us to spend — invest, not spend — but invest dollars in things that we needed to do in order to become self-sustaining and grow. It just simply wouldn’t have happened.
I think now we’re at a point now where self-sustainability it’s very close. We can taste it. Now we’re thinking, how do we now grow and maybe grow faster? There’s another round for us at some point. We are working through that now and as we think about that, whether it’s debt or grant money or even equity, the question that we’re trying to answer is what do we want to be when we grow up? That will help us figure out what that next capital raise looks like.
That’s fantastic. Thank you so much, Maggie.
Thank you.
For Heron.org, this is Deirdre Hess.
Comments are closed here.